The pandemic has slowed down.
All the analysis are based on ECDC figures. Countries do not have similar health infrastructure or reporting, So I am comparing numbers which do have a different basis. This article uses three types of graphs: cumulative death rates, daily death rates and daily vs total death rate.
Cumulative numbers
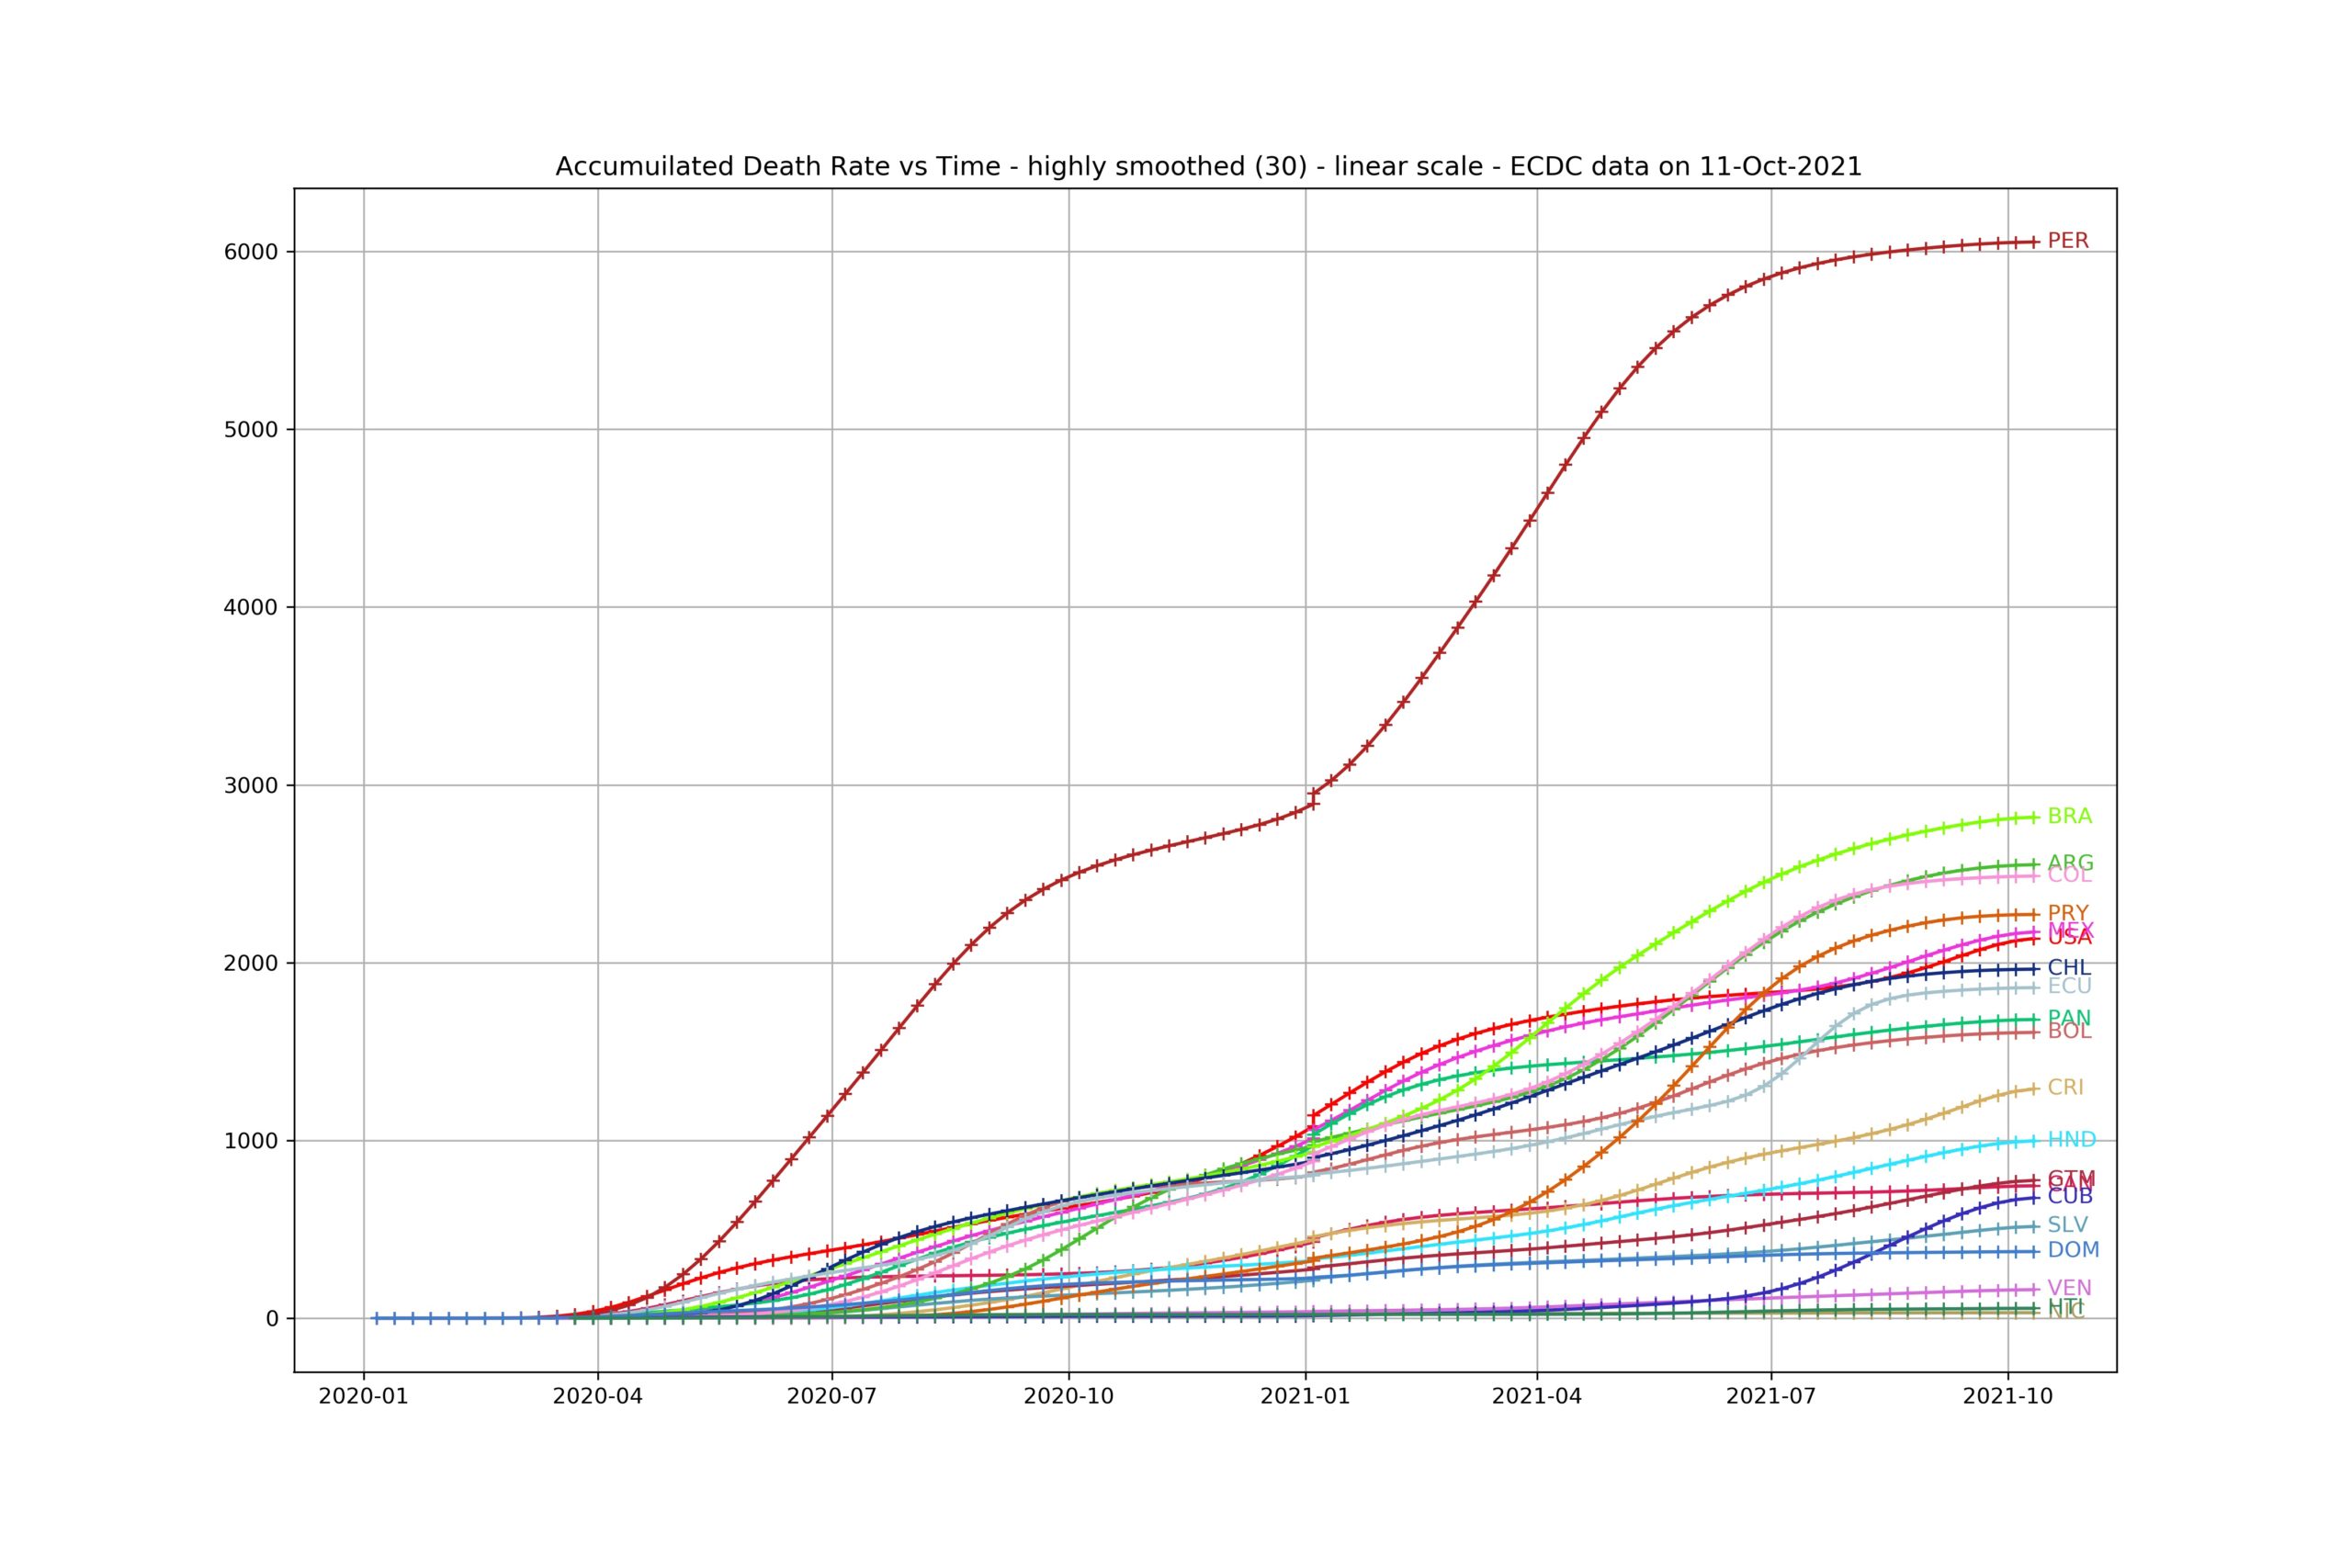
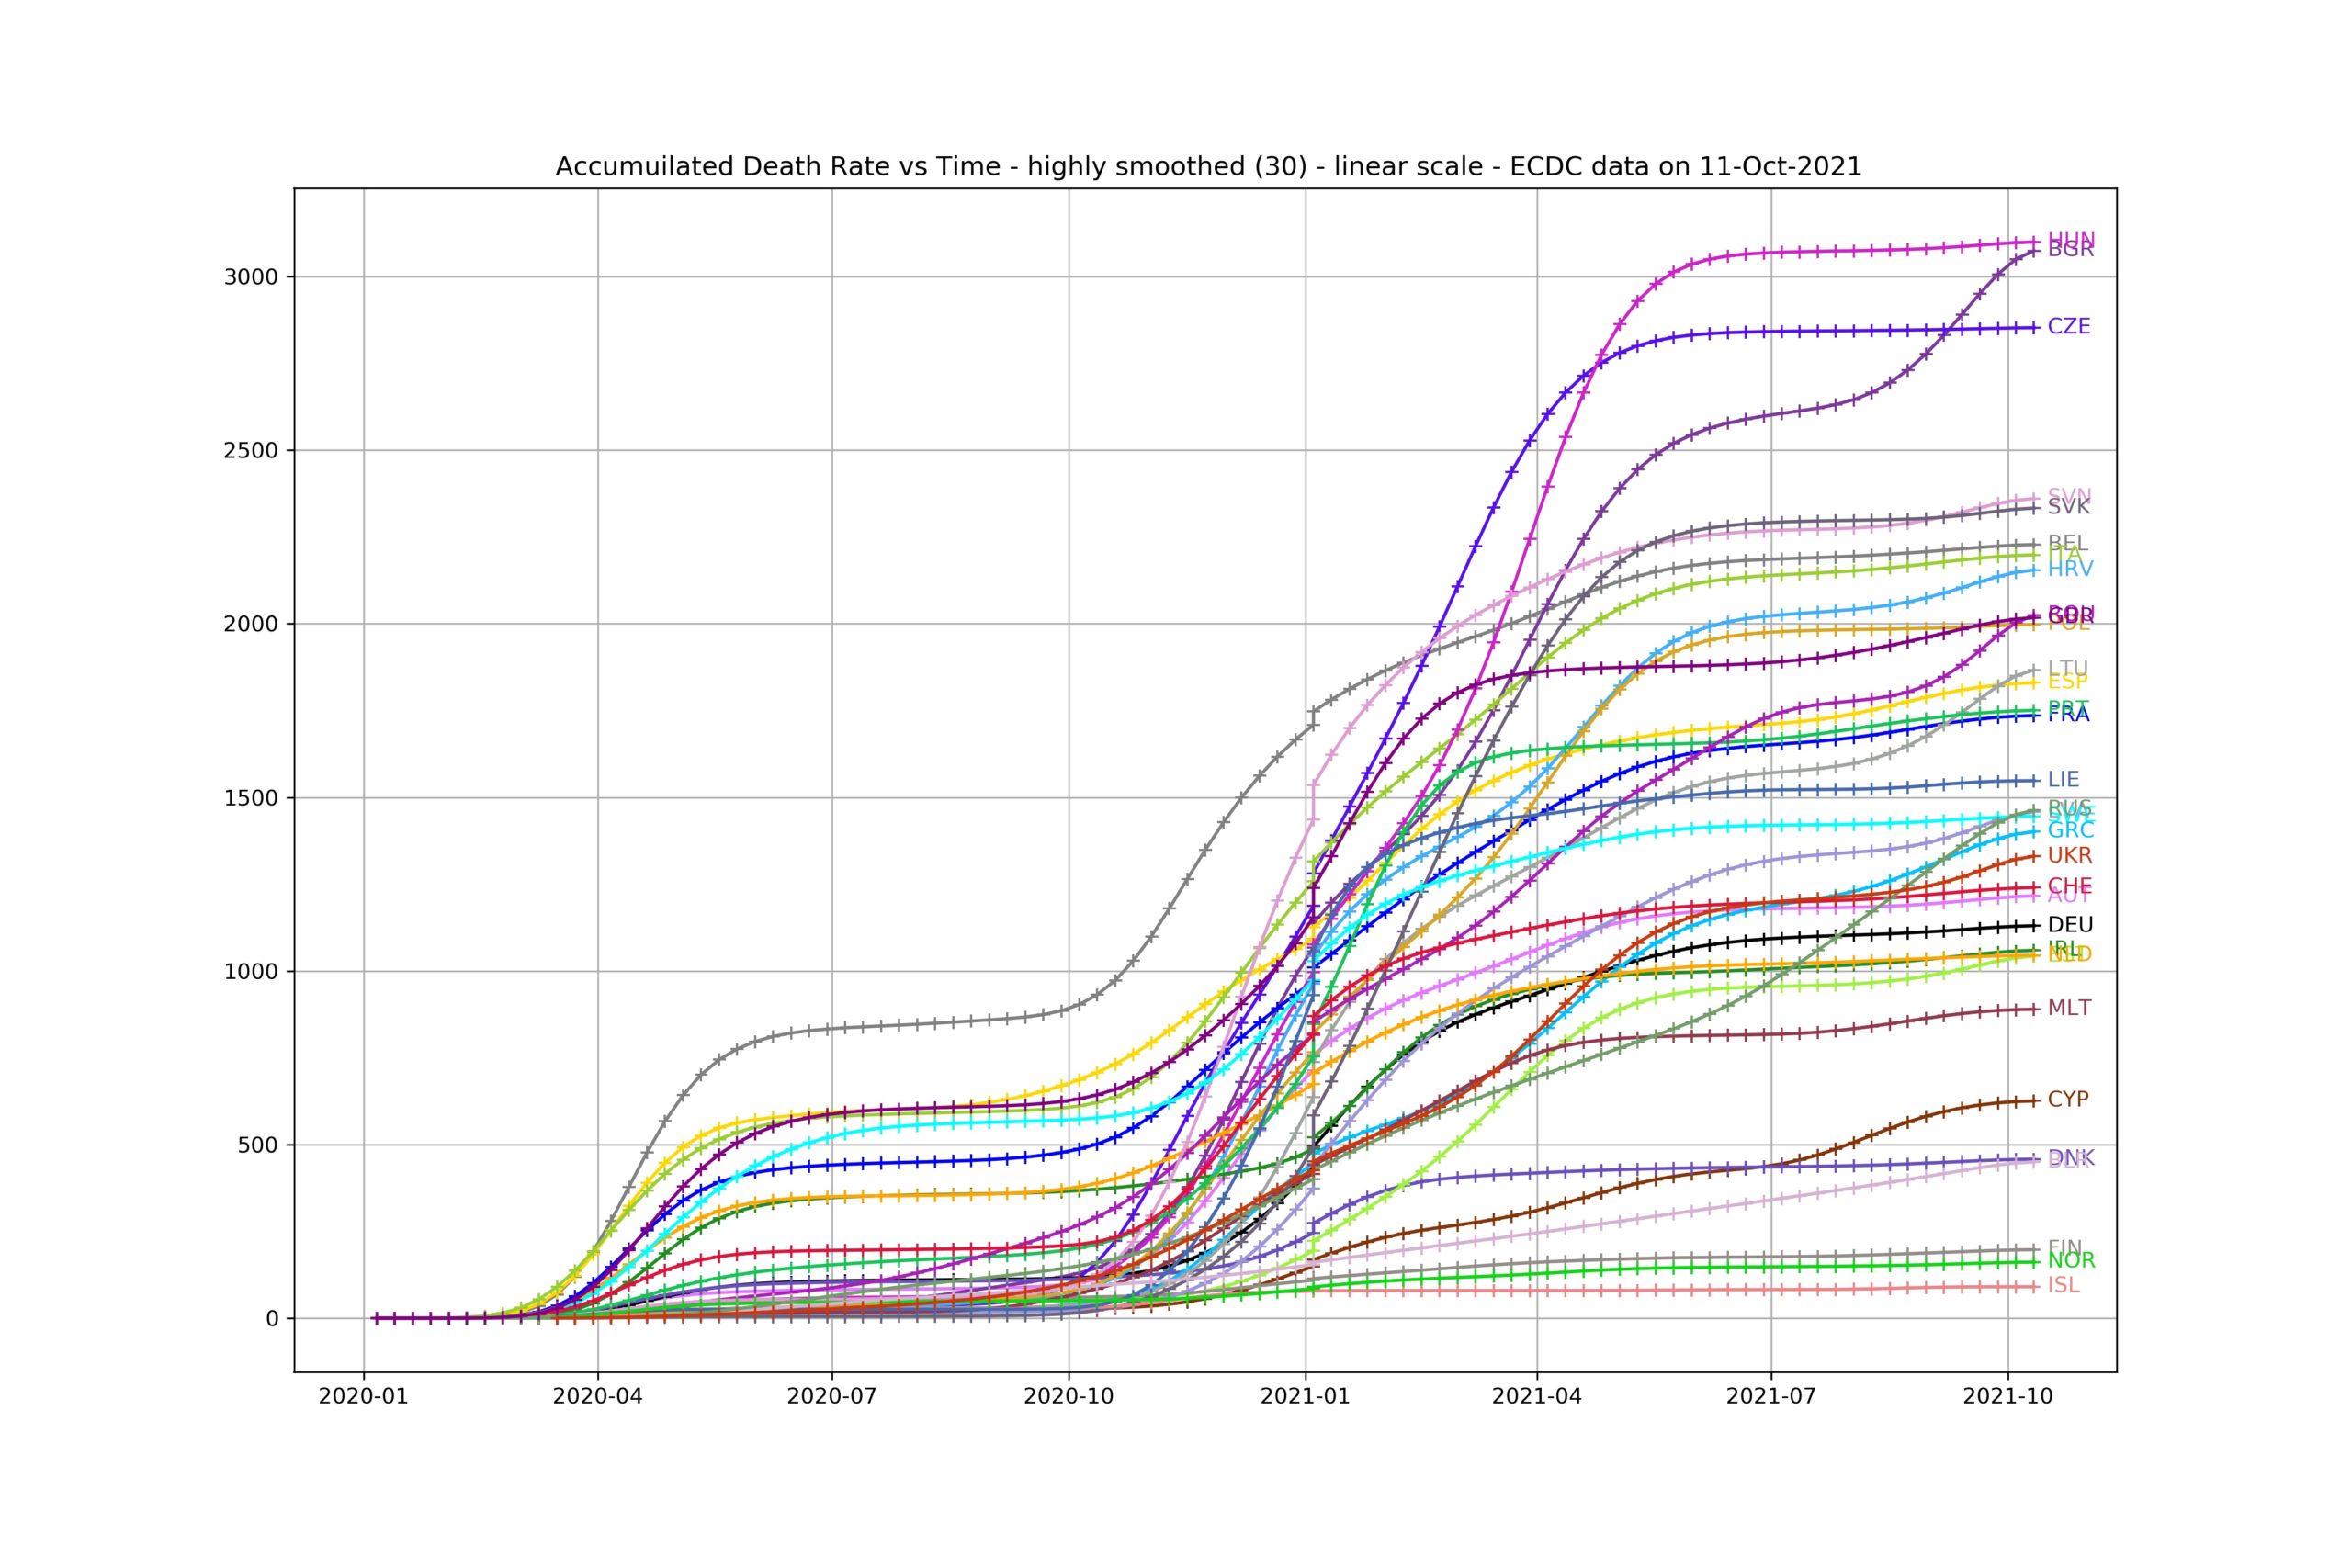
Here is the cumulative death rate over time for all reporting countries.
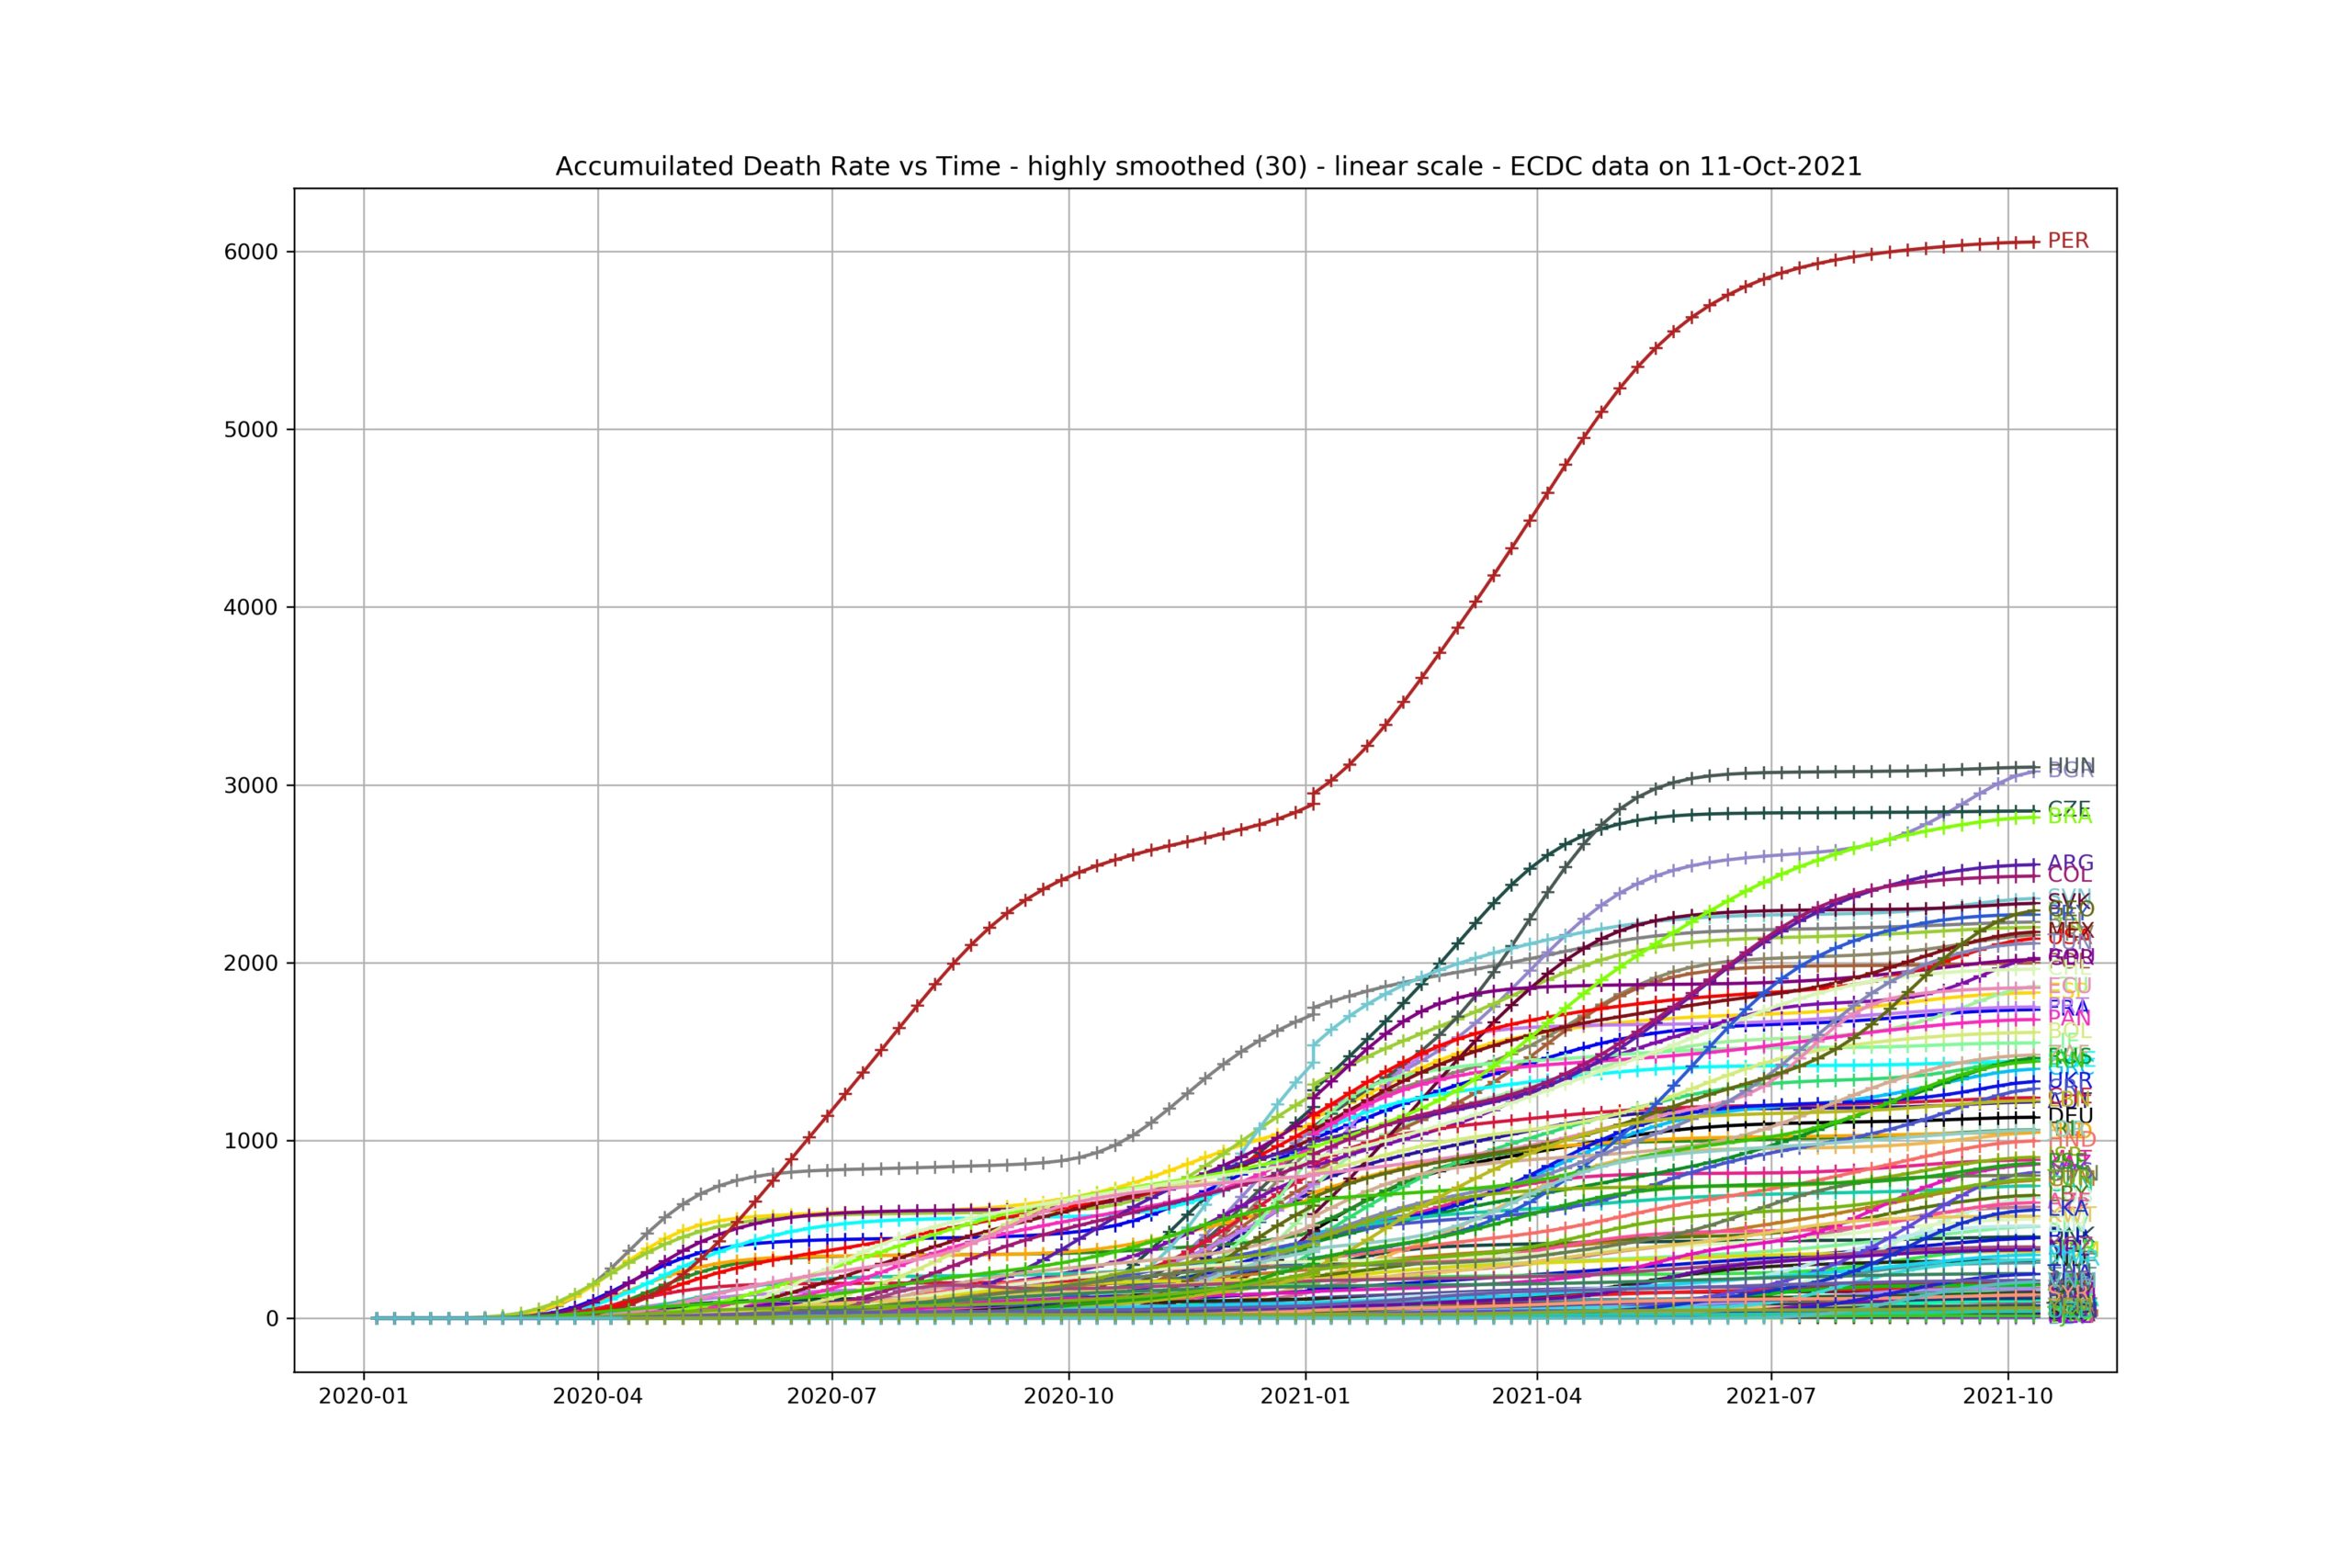
Typically Bulgaria, Hungary, Brazil, Czech Rep, Argentina, Colombia are recorded over 2500 deaths per million inhabitants since the beginning of the pandemic early 2020.
But one country is off the chart. Peru has registered over 6000 Covid deaths per million inhabitant to date. This is to be compared to 5539 deaths per million inhabitants in 2019 in Peru. This statistic means that up to 40% of deaths may have been caused by Covid during the past 20 months.
| Country | Death rate since start per million | Daily increase |
| Peru | 6062 | 1 |
| Bulgaria | 3204 | 13 |
| Hungary | 3112 | 1 |
| Czechia | 2857 | 1 |
| Brazil | 2838 | 2 |
| Argentina | 2560 | 1 |
| Colombia | 2494 | 1 |
| Georgia | 2384 | 9 |
| Slovenia | 2383 | 2 |
| Slovakia | 2355 | 3 |
Daily vs Total
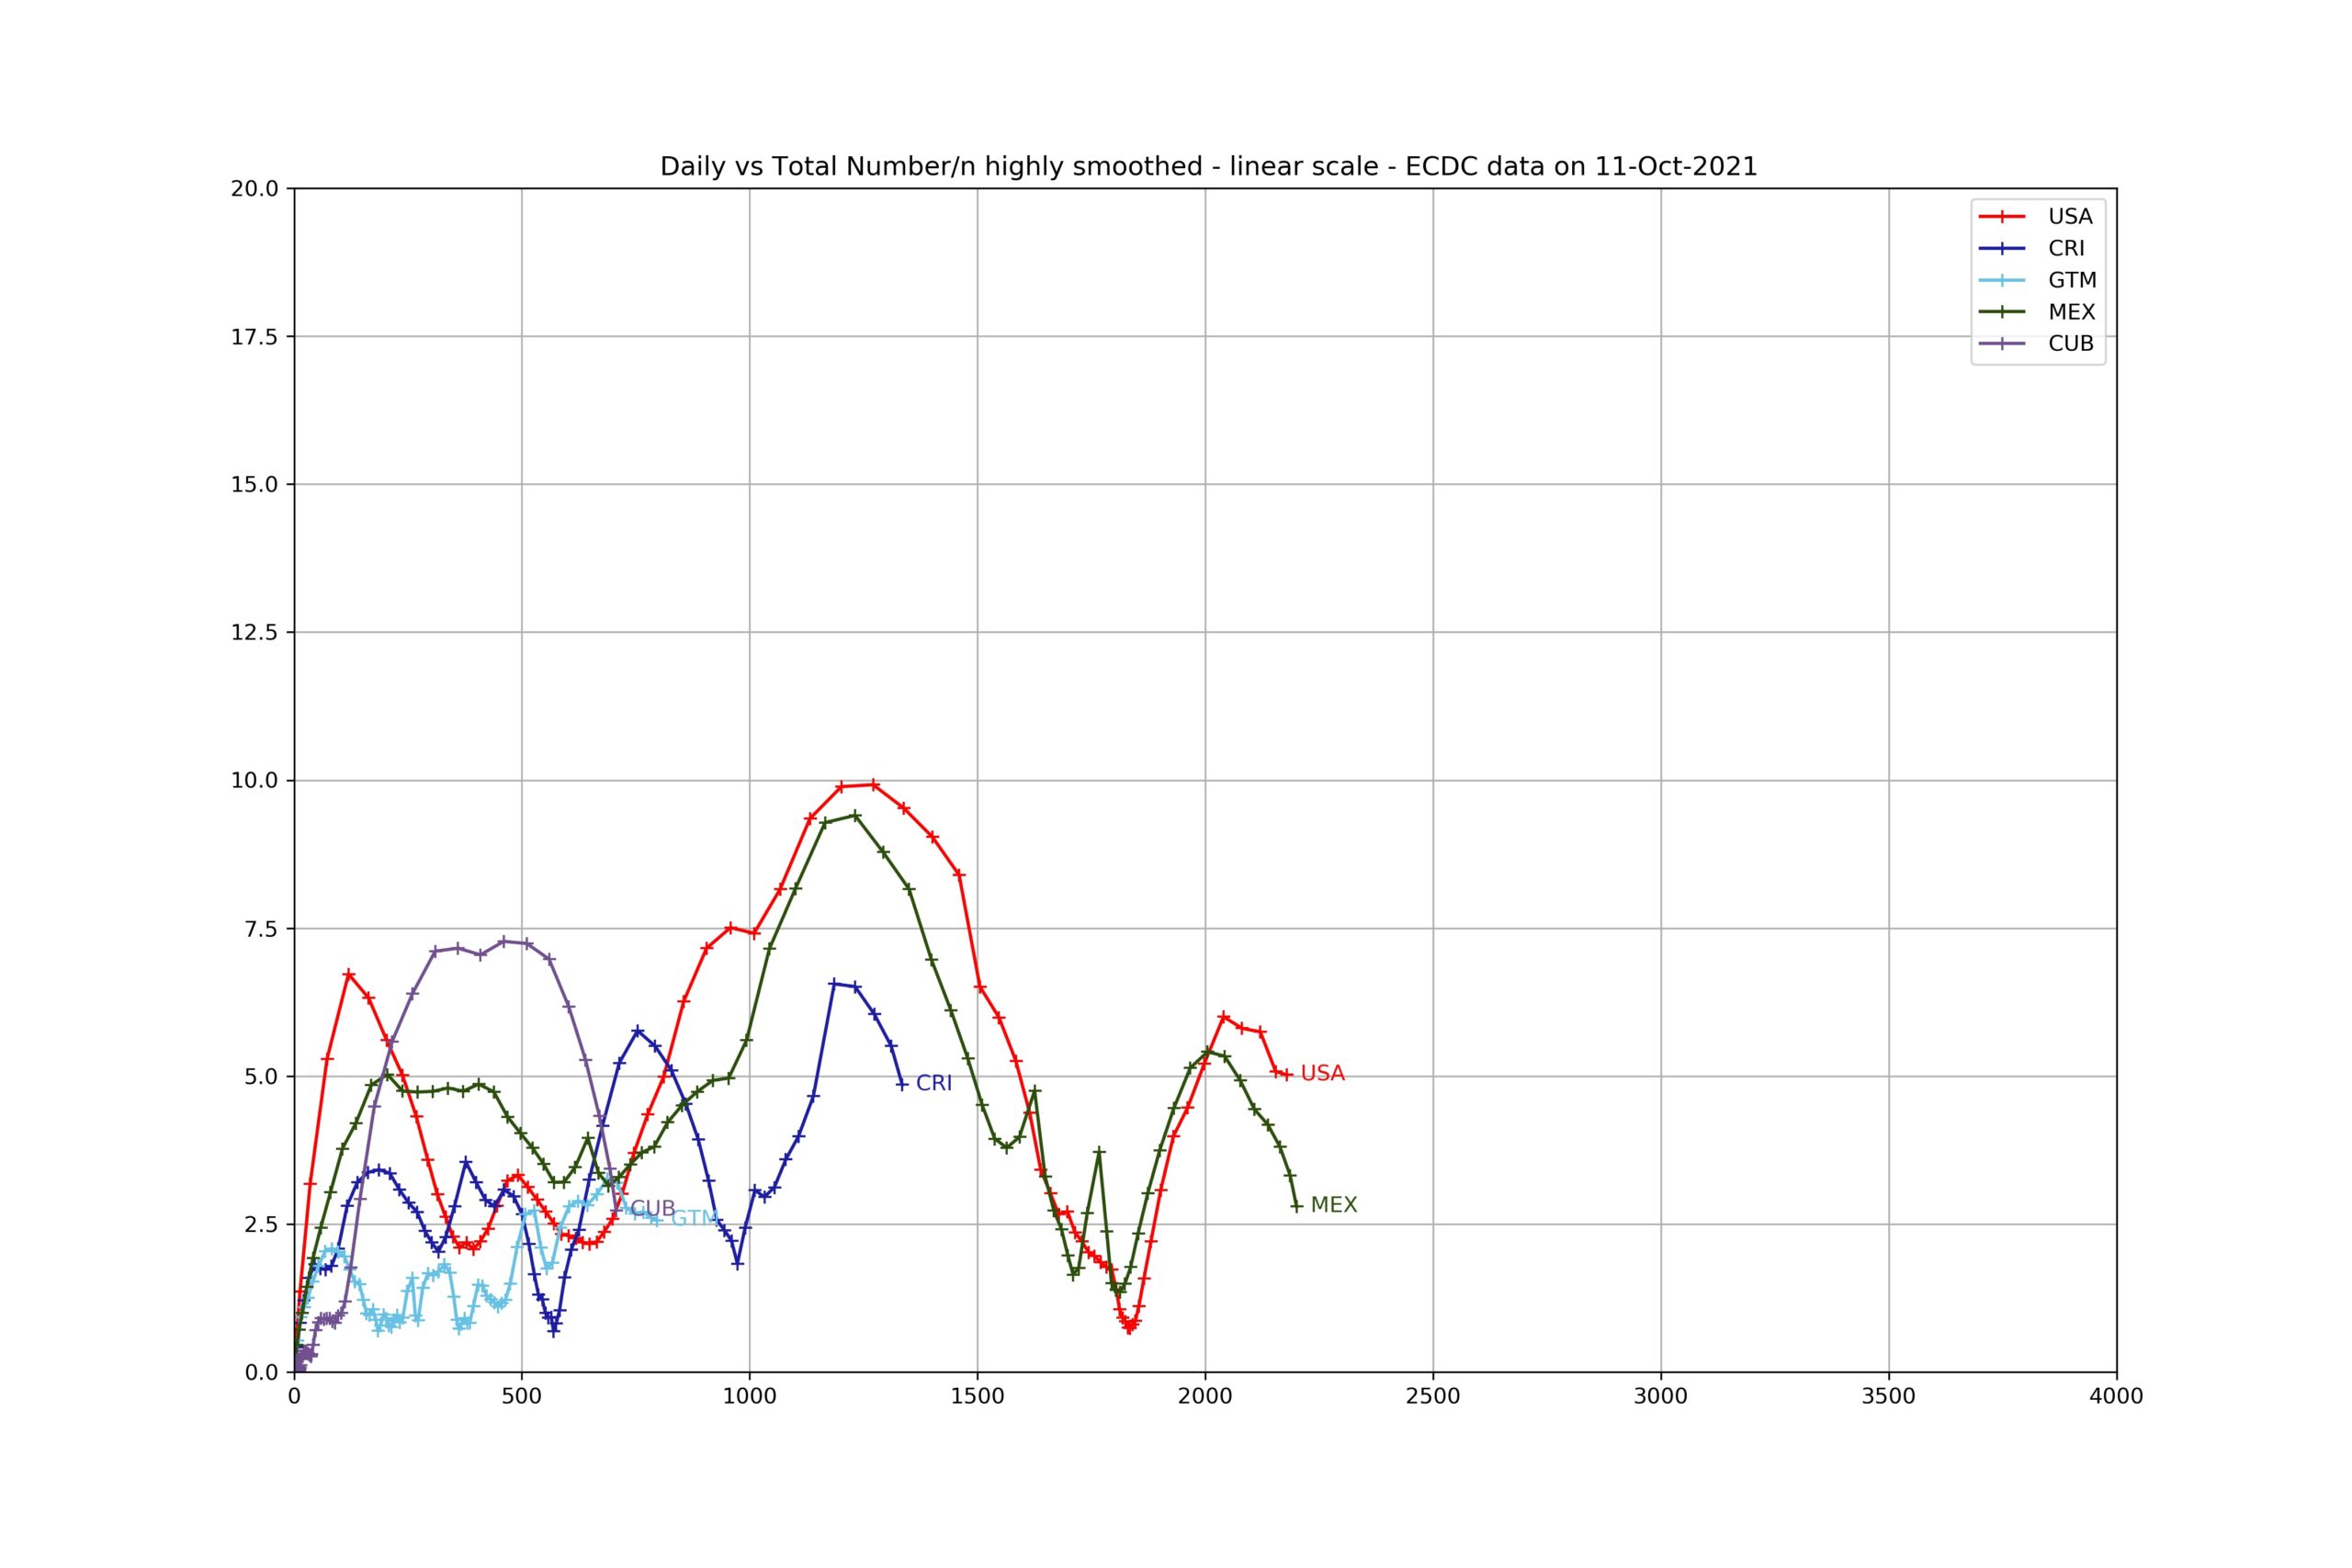
With the Daily vs Total Covid graph below, the higher a country is the most active the disease is currently, the further right the country is the most lethal the disease has been to date. Let’s plot all countries with a daily death rate over 2.5 (deaths per million inhabitants per day)
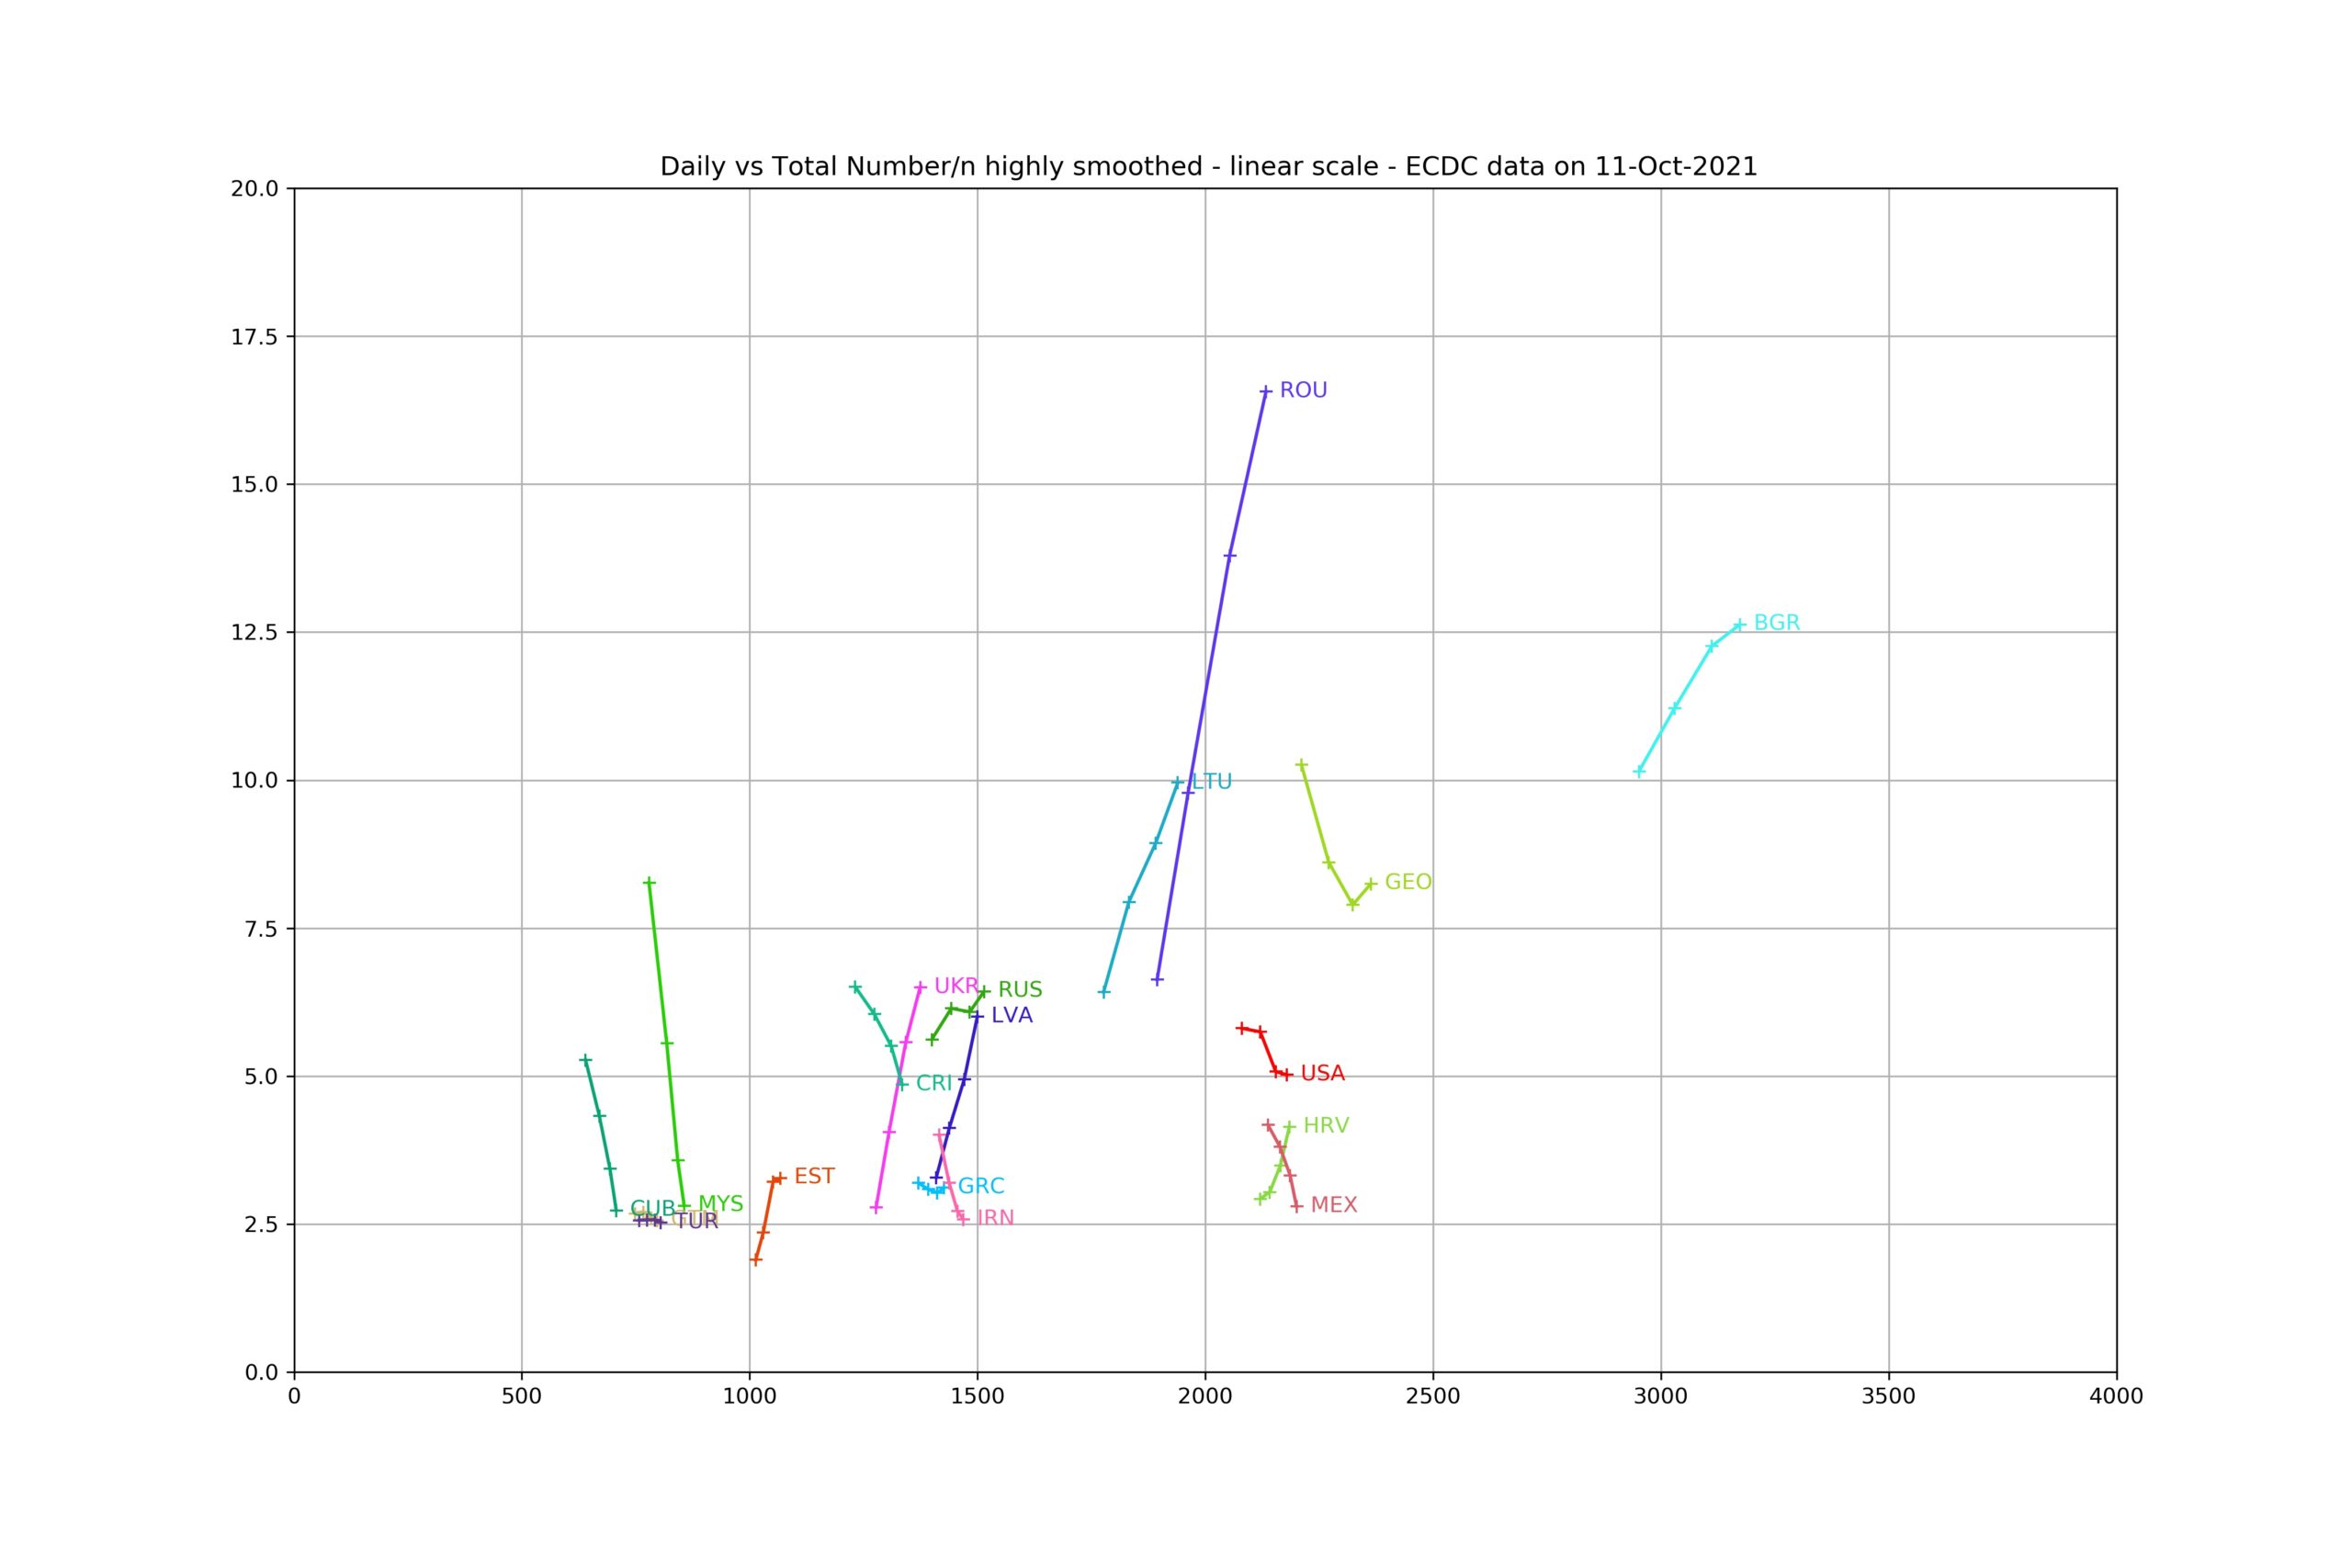
The graph shows the values of the past four weeks. The name of the country is close to the latest value.
Romania, Bulgaria, Lithuania and Georgia are currently the most Covid lethal countries, as per this reporting, with daily rates over 7,5 per million per day, which corresponds to over 2500 on a yearly basis.
Above 5, there are the USA, Russia, Ukraine and Latvia. Very close inS Costa Rica just below 5.
The other ones above 2.5 are Cuba, Malaysia, Turkey, Esonia, Greece, Iran, Croatia and Mexico. Croatia is increasing when Mexico is decreasing.
| Country | Daily Increase | Daily Increase (4 week average) |
| Romania | 18 | 12 |
| Bulgaria | 13 | 12 |
| Lithuania | 11 | 8 |
| Georgia | 9 | 9 |
| Ukraine | 7 | 5 |
| Russia | 7 | 6 |
| Latvia | 7 | 5 |
| United States Of America | 5 | 5 |
| Croatia | 5 | 3 |
| Costa Rica | 4 | 6 |
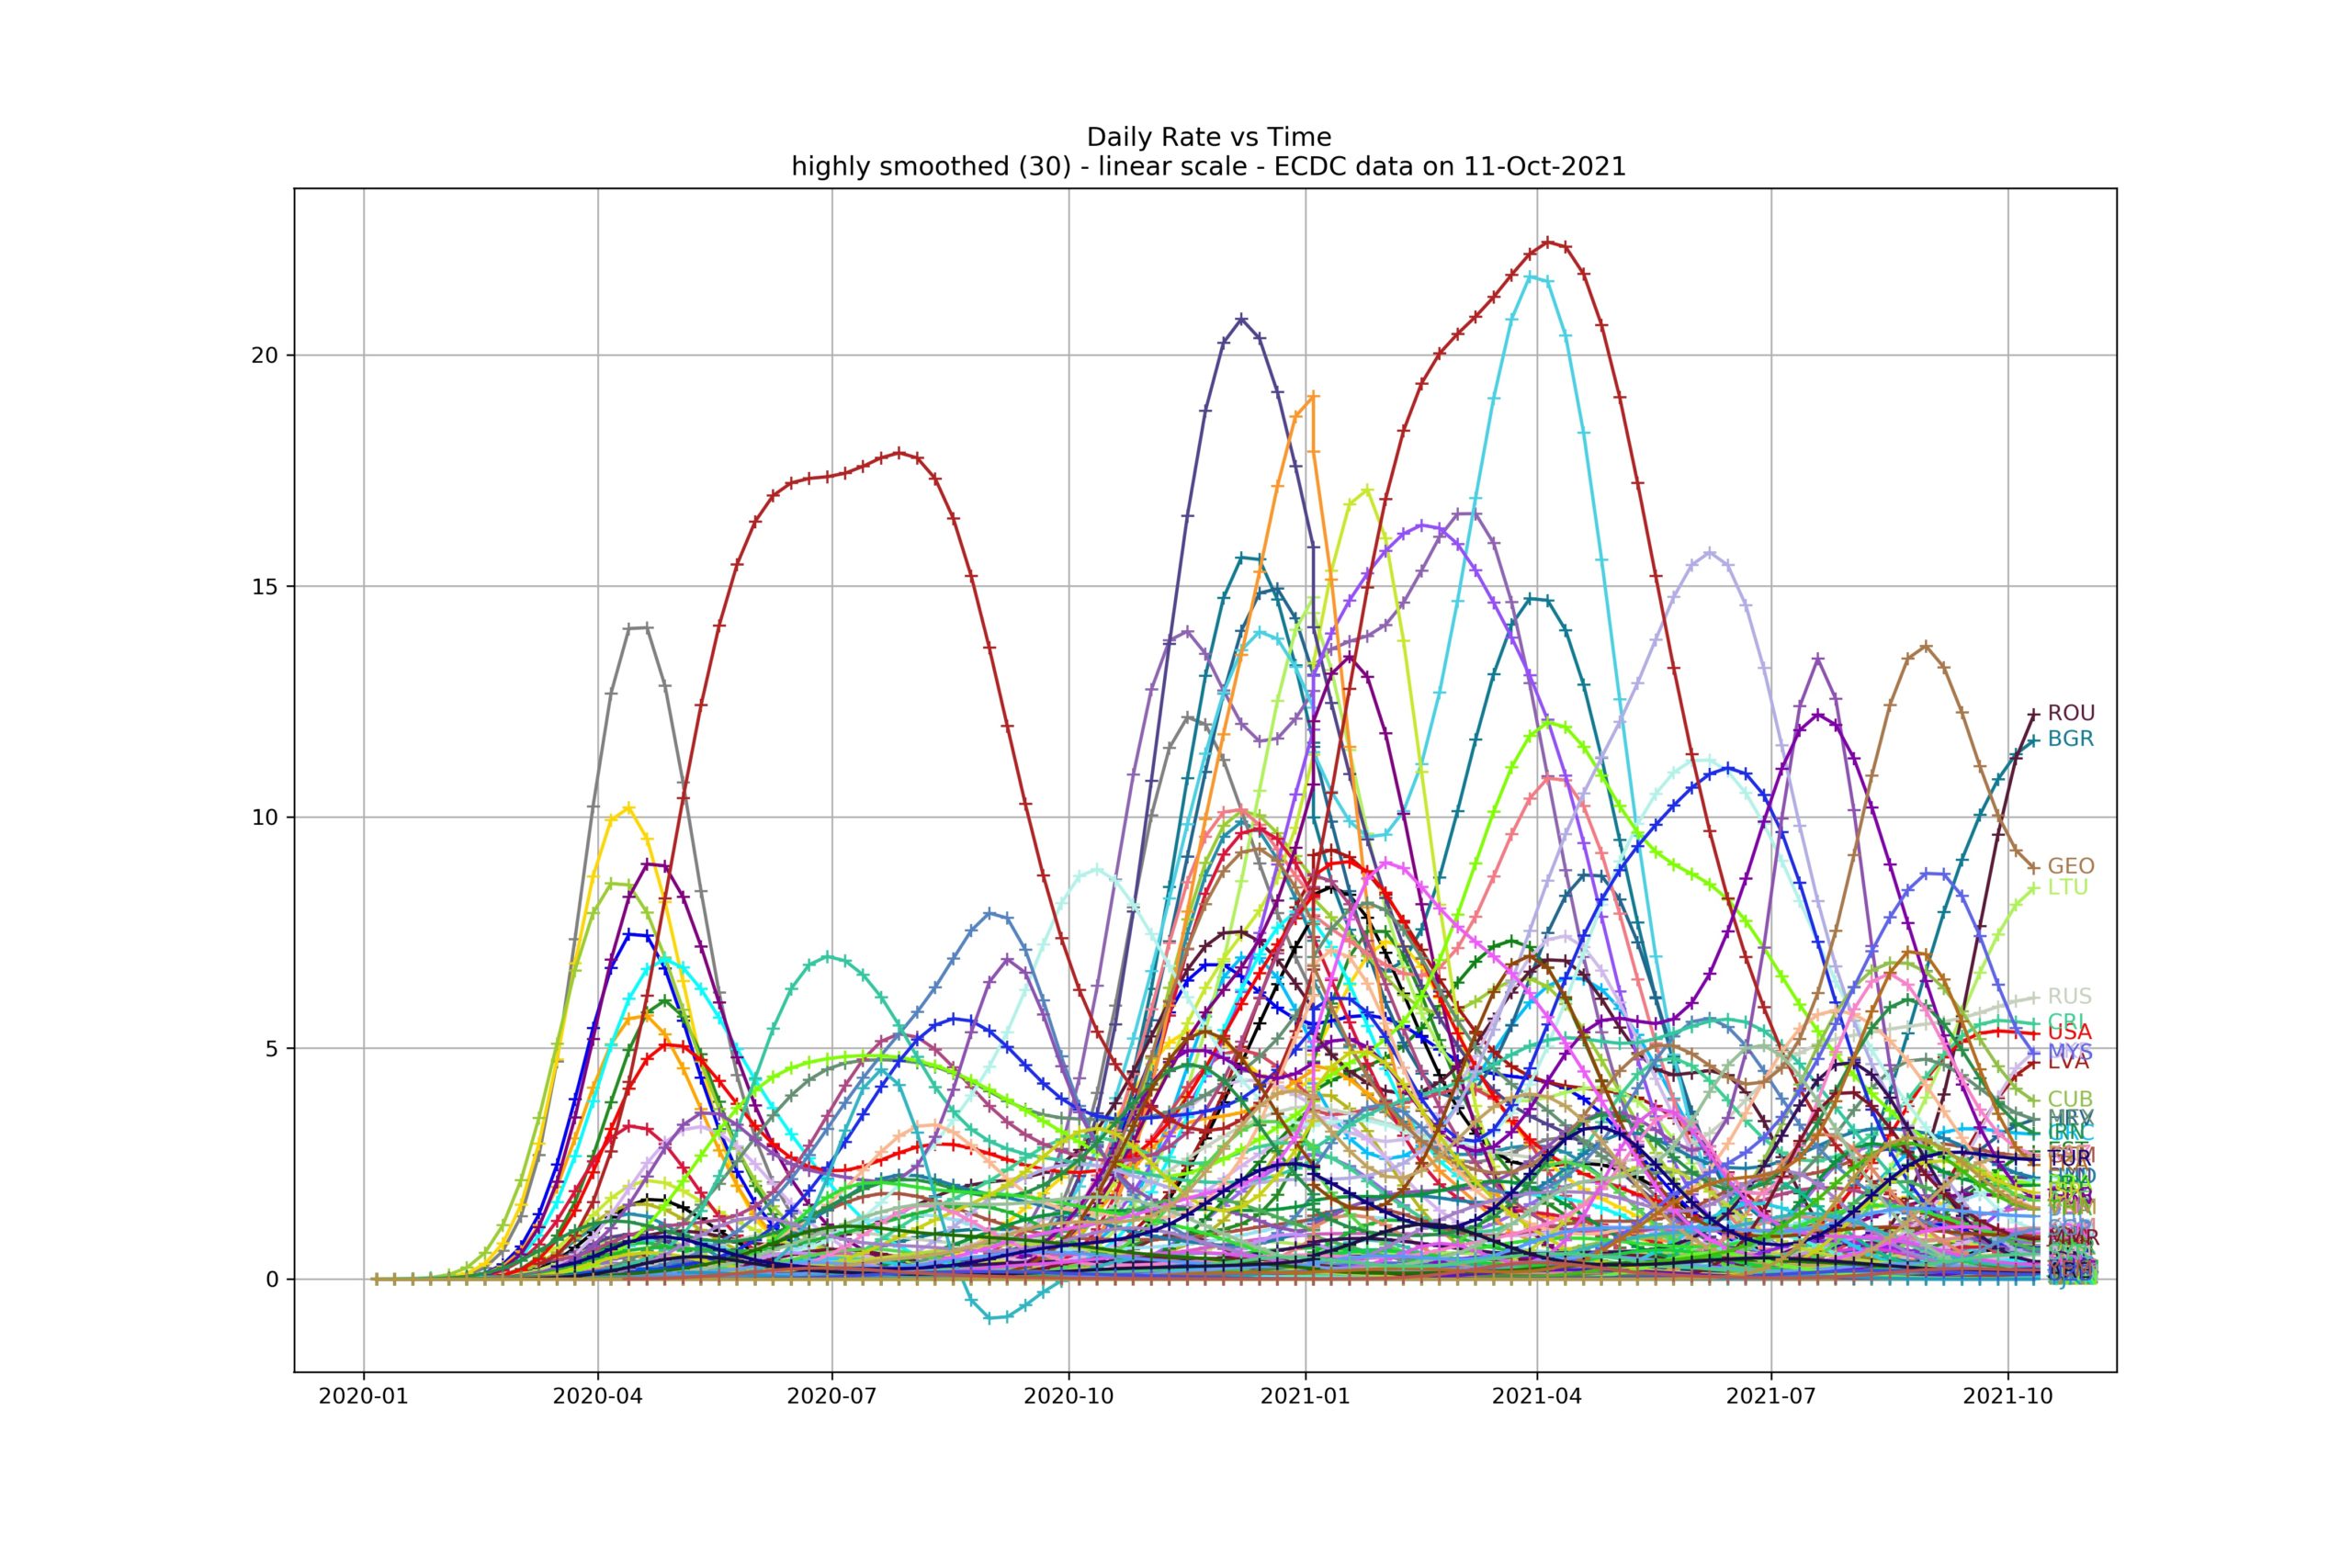
Evolution over time
Looking at the mortality against time for all the countries in the world, the first outbreak from March 2020 hit only few countries, mostly in Western Europe (Belgium in Grey color) and then most countries registered a strong decrease in June 2020.
The second wave kicked in October 2020. Many countries were hit during the automn and the winter. There were different periods of decrease in March 2021 at the earliest, in June, and finally in September and October 2021.
The first seriously hit country is Belgium in grey (April 2020). Then in firebrick, Peru is the highest curve on the graph.
Let’s review the situation per continent.
Africa
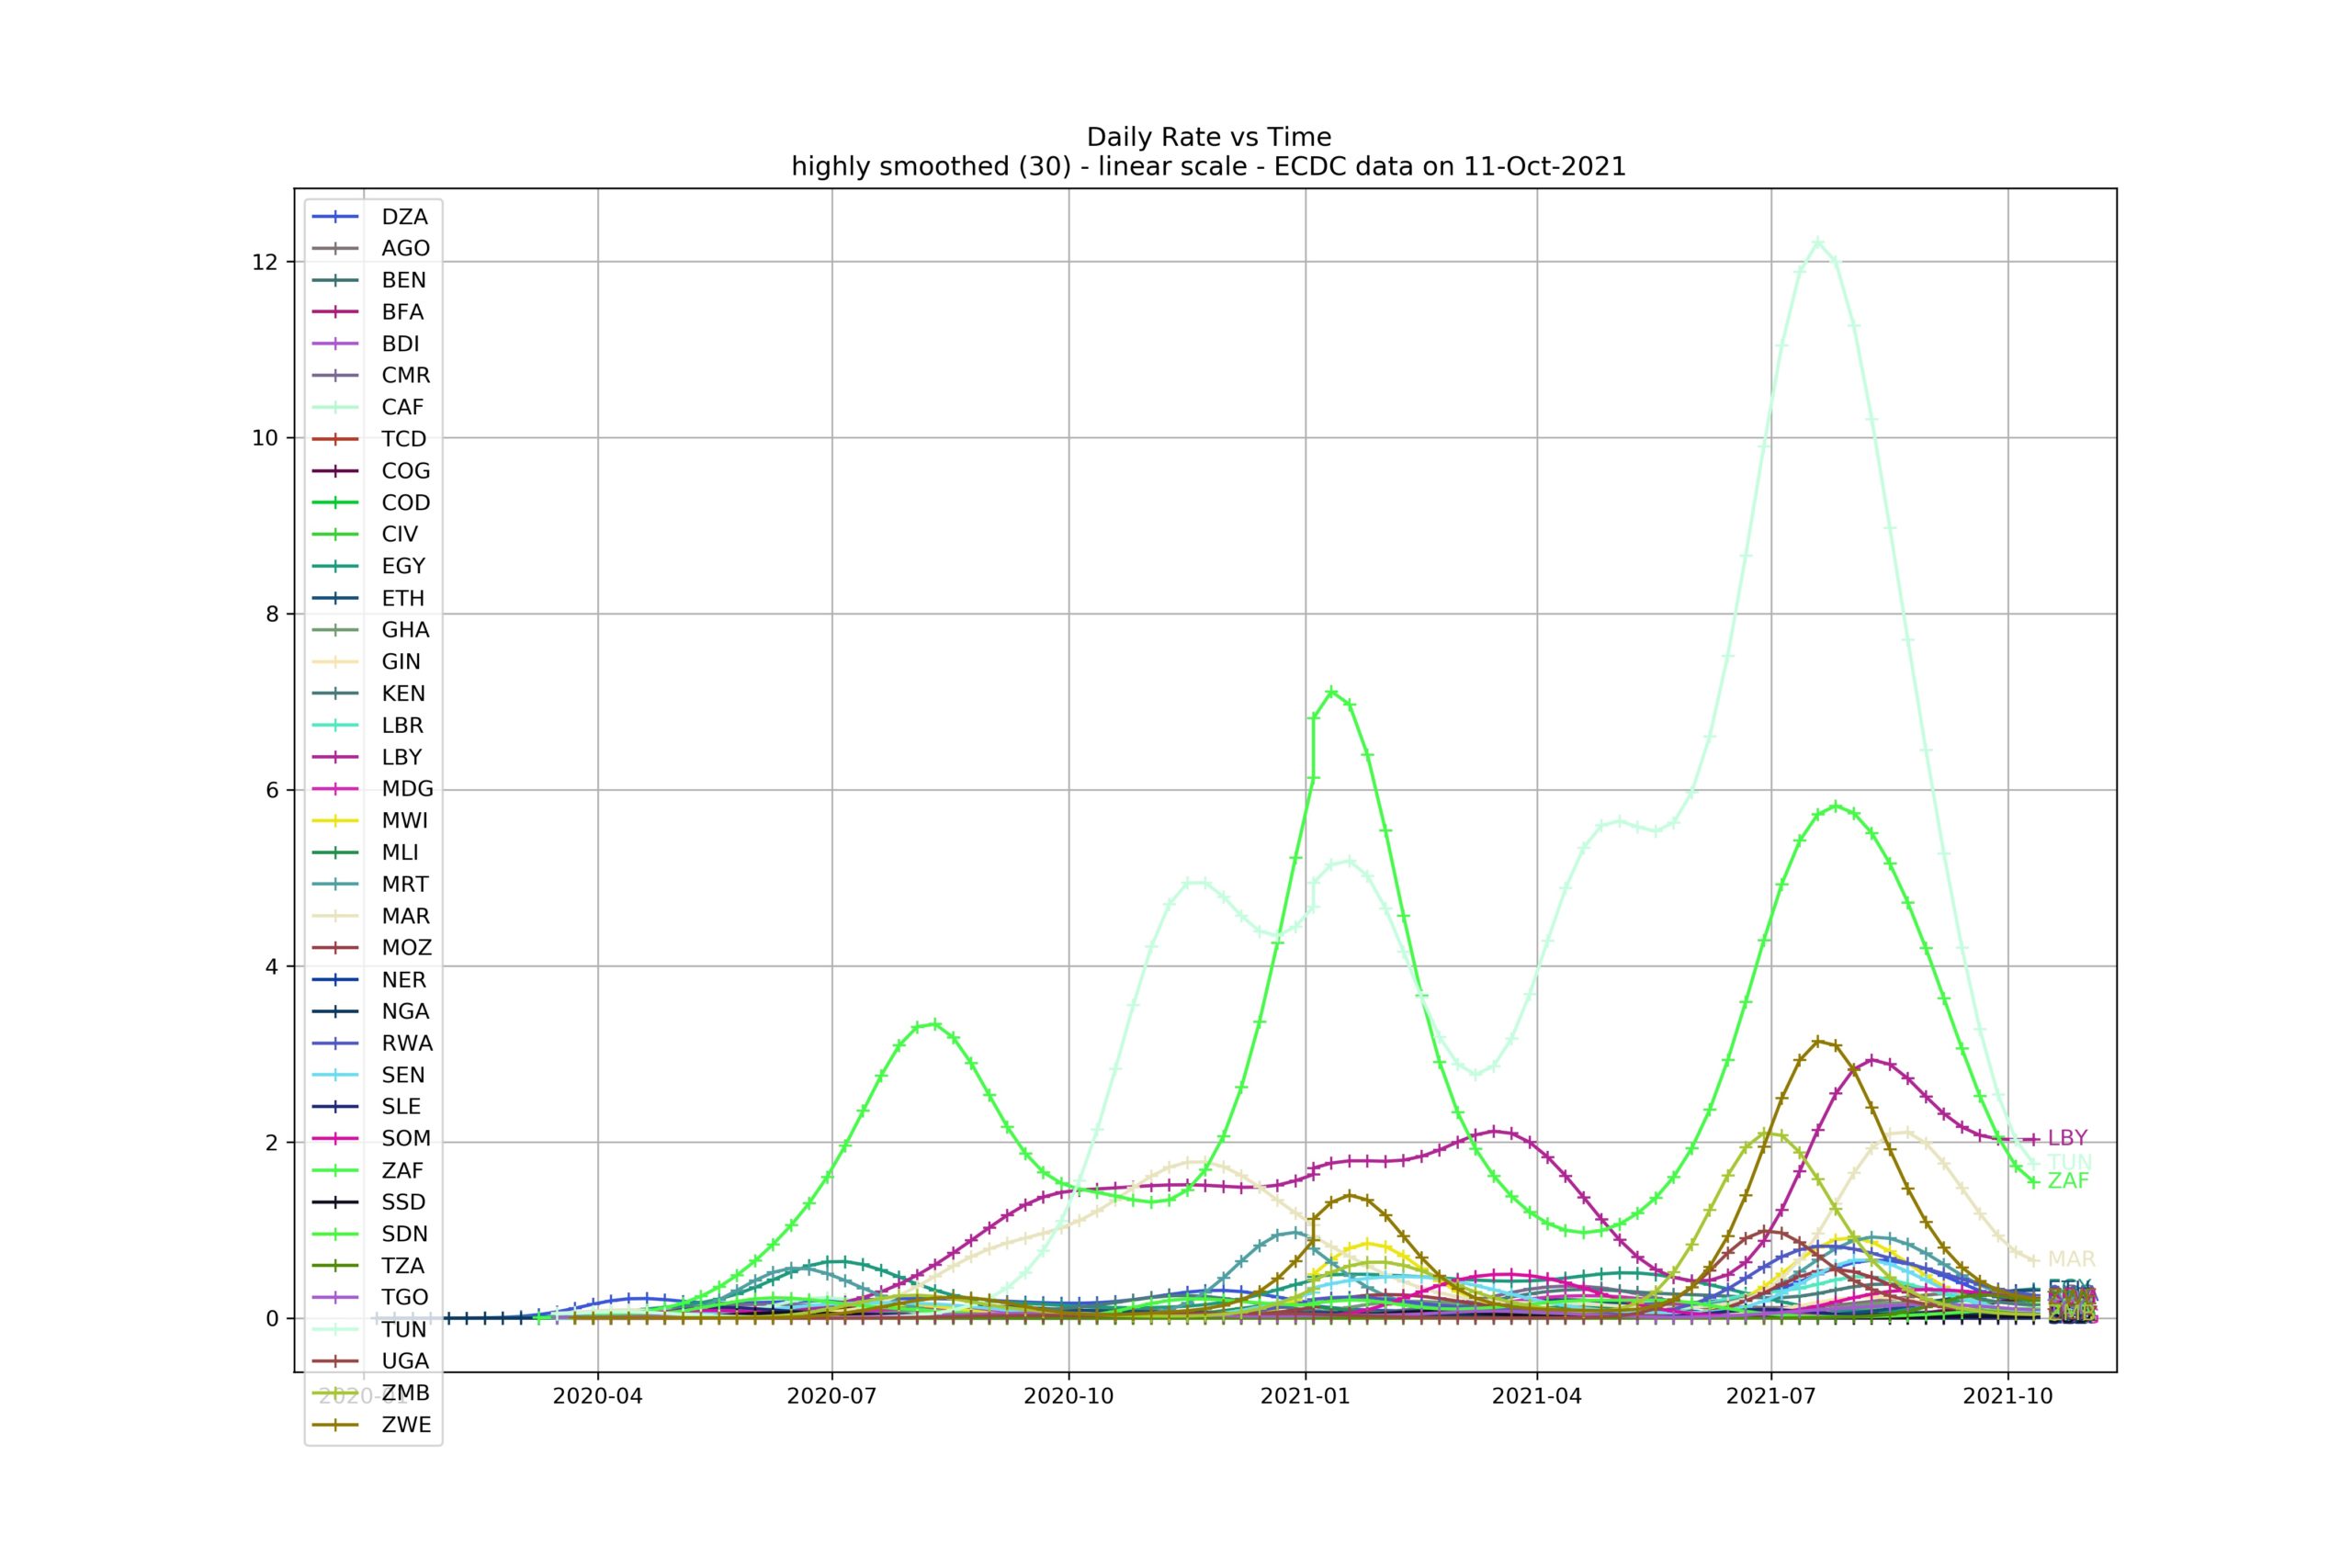
According to these stats, only Tunisia and South Africa were significantly affected with over 1000 deaths per million inhabitants to date. Morroco, Libya and Zimbabwe were affected by Covid (above 250). All other countries have reported lower death rates.
Reporting covid disease might not be a priority in Africa…
Americas
Americas.
Peru has already been quoted as the worst country. Above 2500 are Brazil, Argentina, Colombia. Between 2000 and 2500 Paraguay Mexico and the USA.
The pandemy is not active except in Costa Rica and the US of A where is it is around 5 deaths par day per million inhabitants (1800 per year).
Asia (and Oceania)
According to these stats, only Georgia, Iran, Lebanon and Jordan were significantly affected with over 1000 and the pandemic is only active in Georgia. There is no impact in Eastern Asia : China, Japan, Austalia, New Zealand, South Korea, Singapore, Taiwan have all recorded less than 150 deaths per million inhabitants to date. India is at less than 350. There is an increasing virus activity in Singapore at only 2 deaths per million per day but rising sharply.

Europe
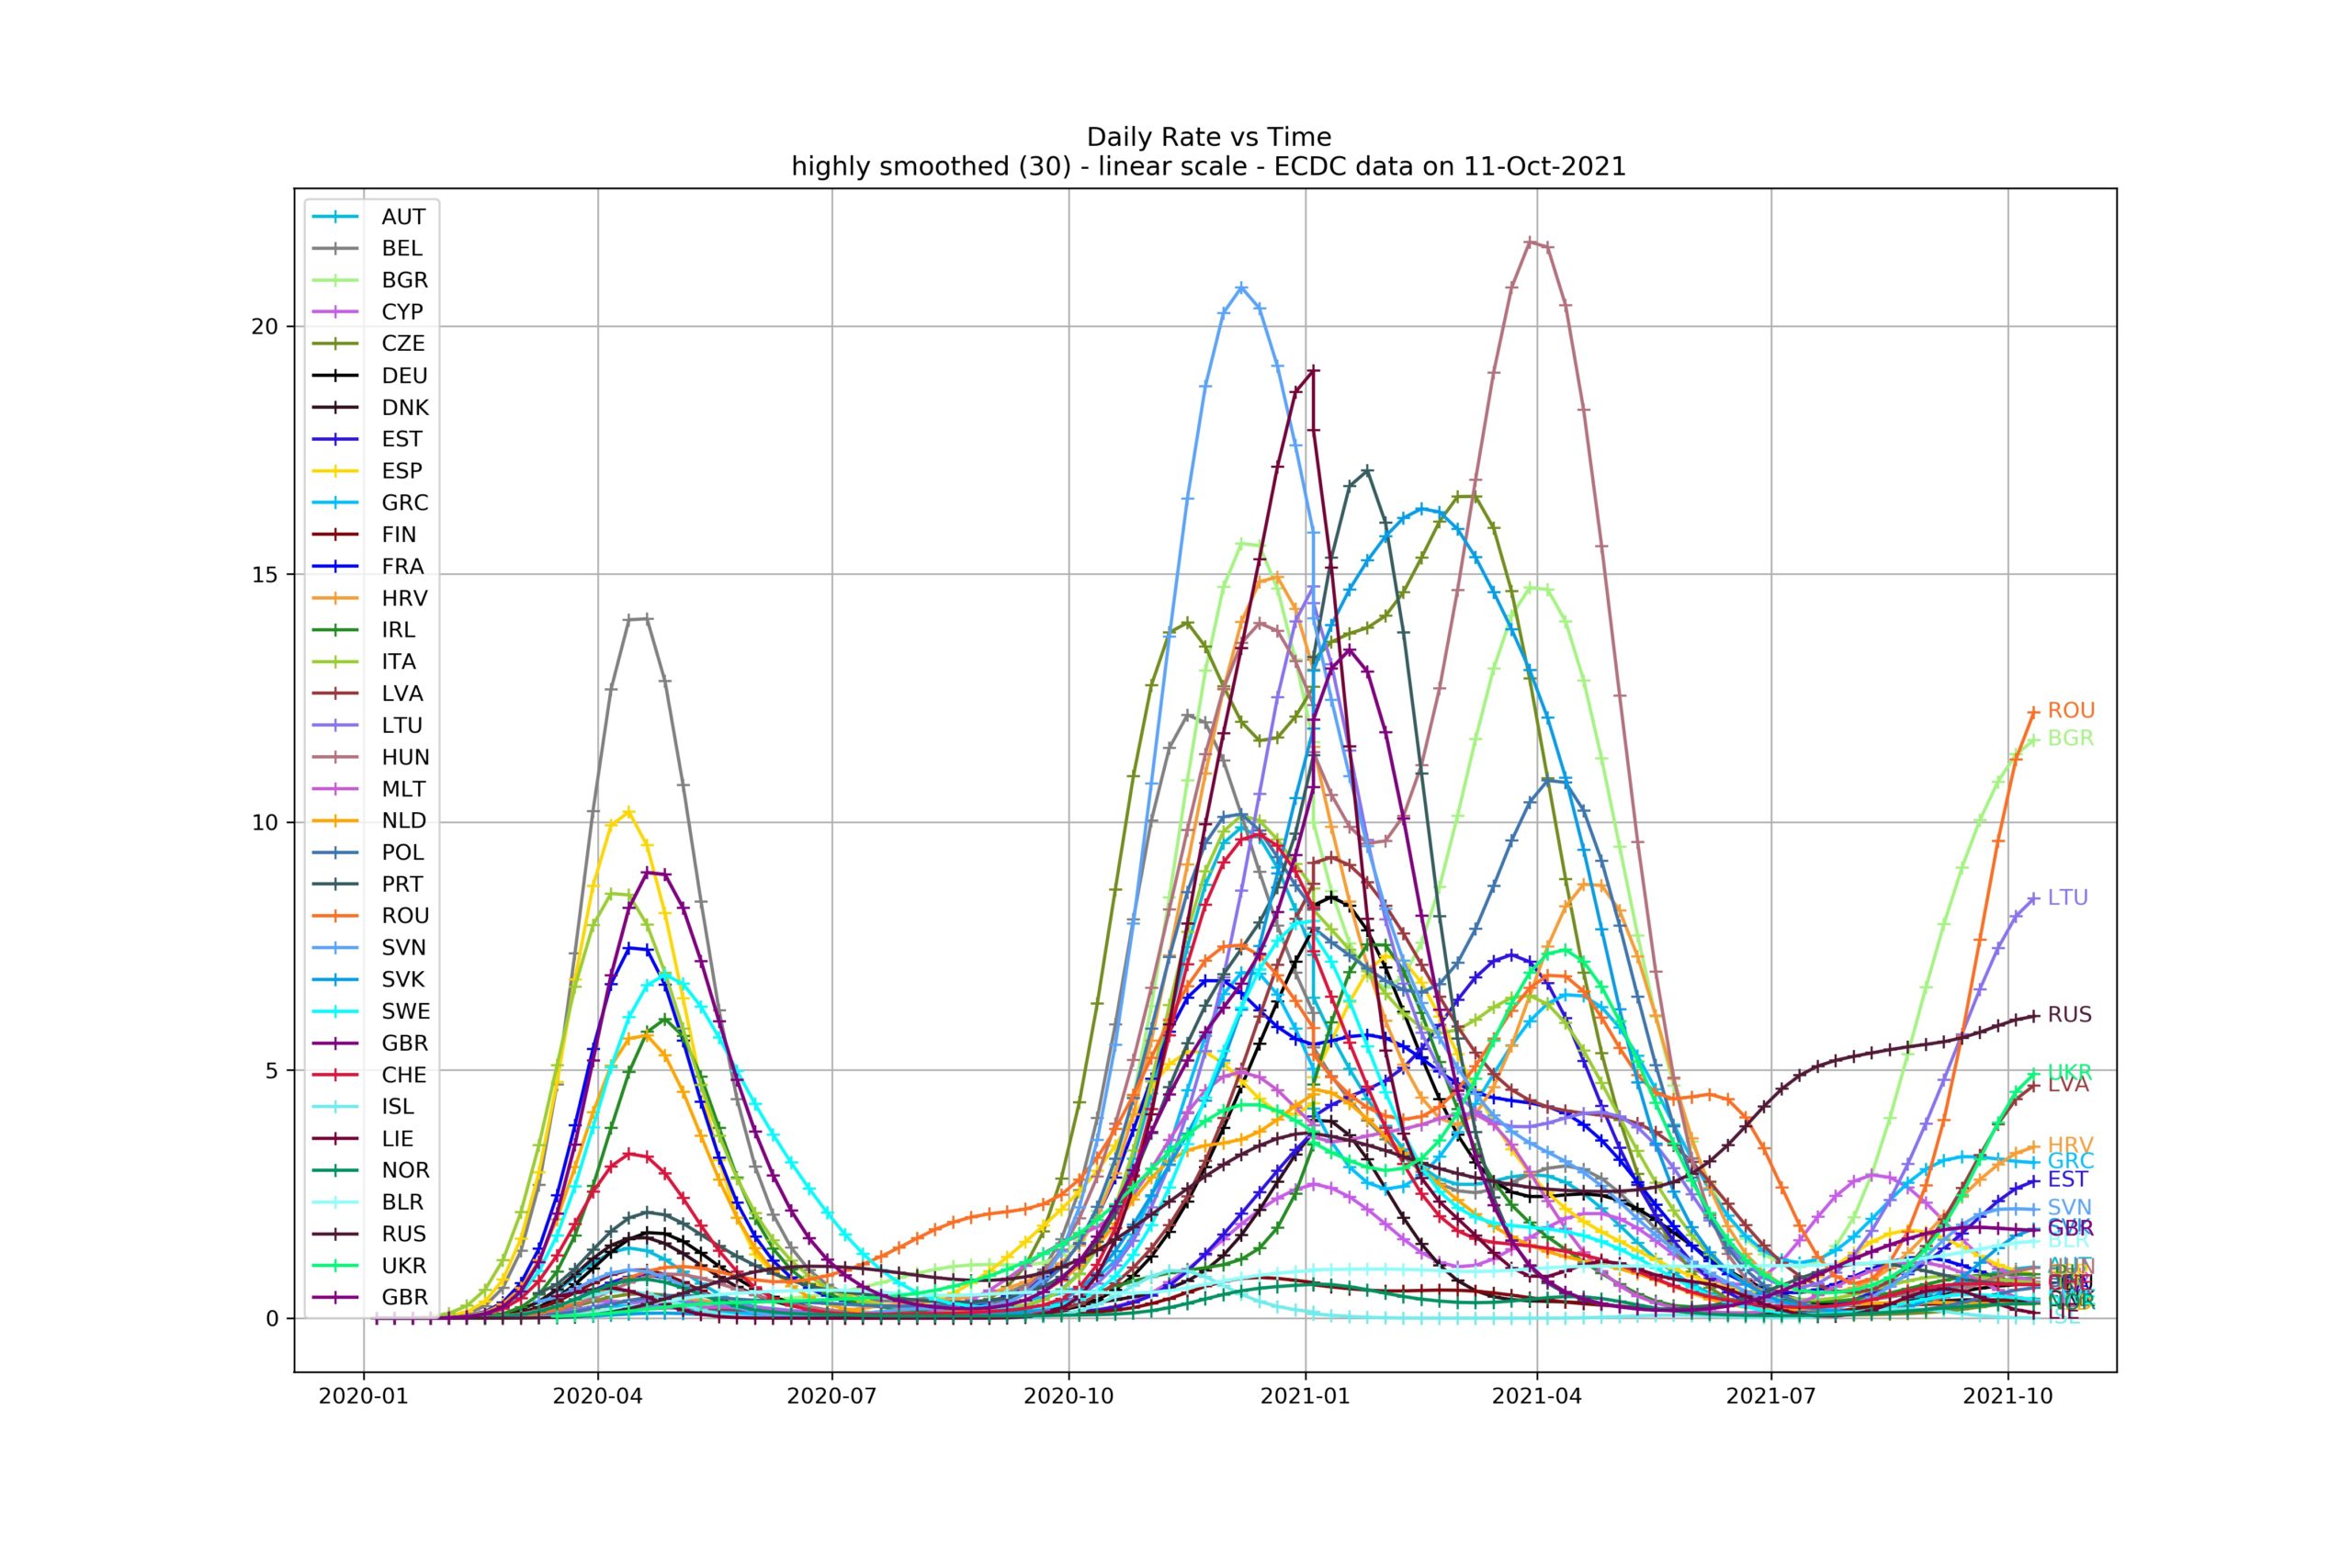
The daily rate graph shows a clear first wave between March and July 2020 for a few country in Western Europe. The second wave starts from October 2020 for most countries with a peak in November-December 2020. Some countries have a second peak in April 2021 and the pandemy slows down at the end of June 2021. A new wave starts in August-September 2021 in a few eastern countries (Romania, Bulgaria, Lituania, Latvia, Ukraine). These countries were not impacted by the first wave that hit the Western countries.
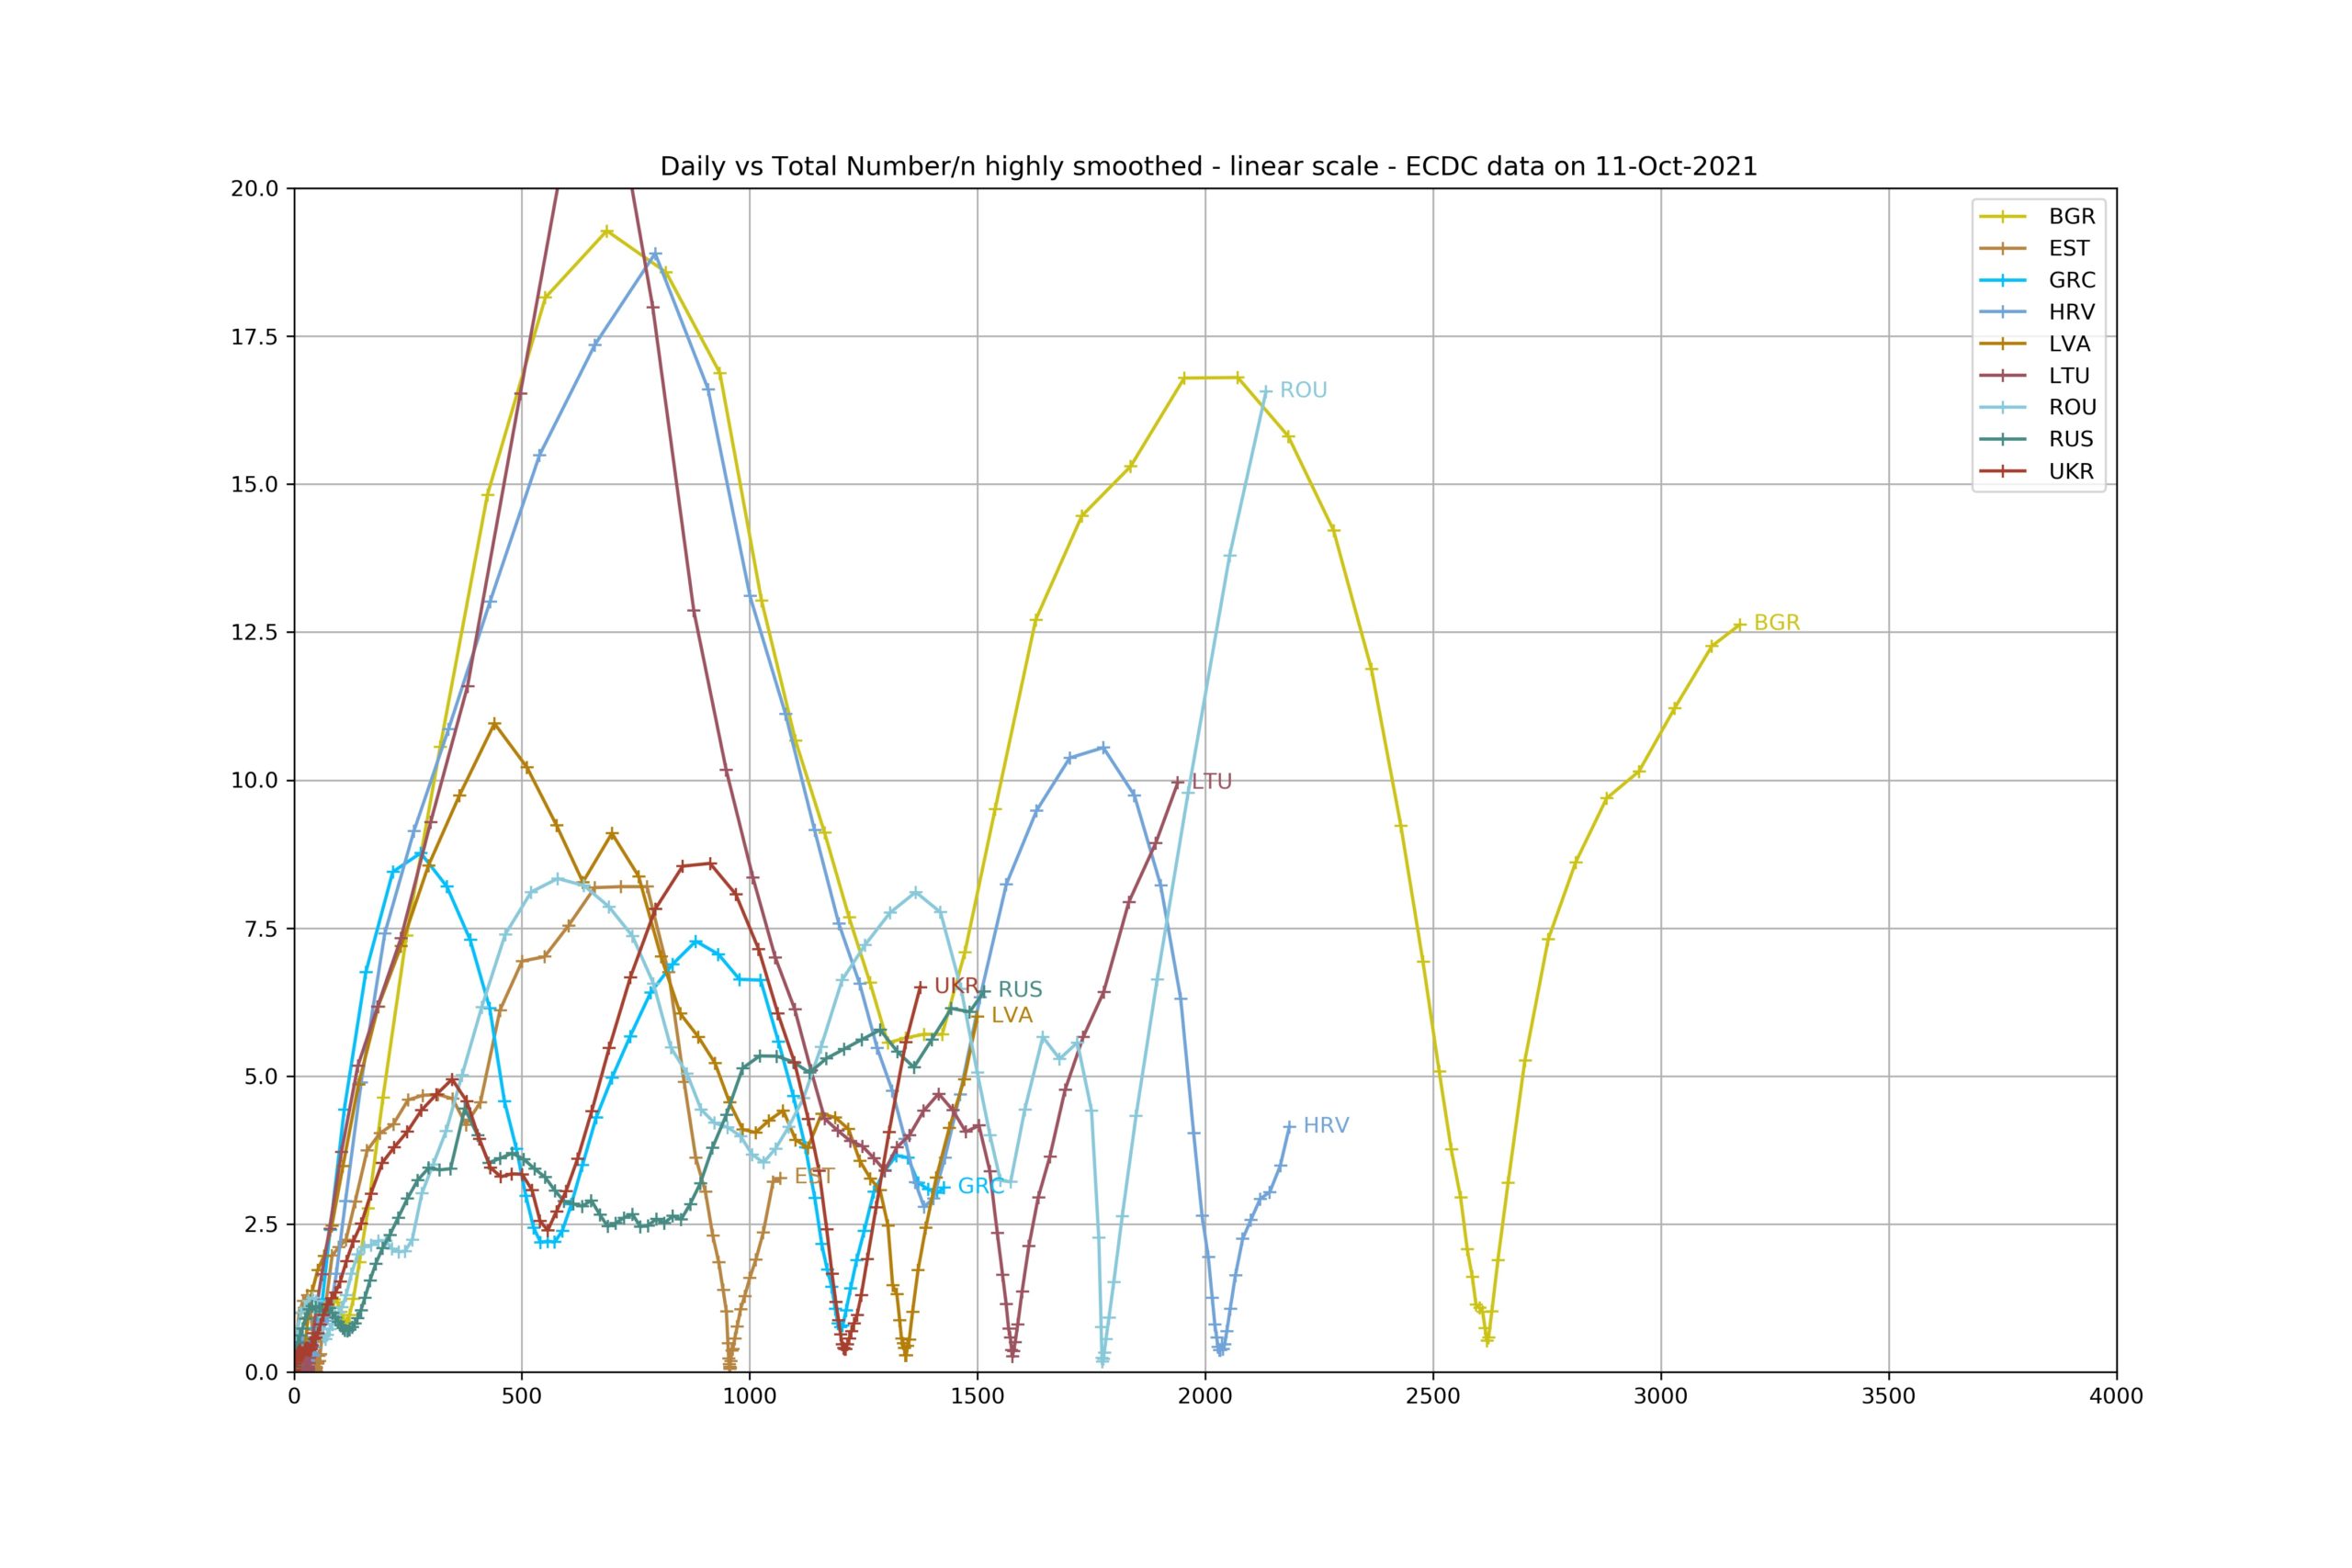
As mentioned above, Romania, Bulgaria, Lithuania, are currently the most Covid lethal countries in Europe,with daily rates over 10 per million inhabitants per day, which corresponds to over 3500 on a yearly basis.
Above 5, there are , Russia, Ukraine and Latvia
Russia, just like the US, are a large and populated countries with an average low density and large cities. Analysing them would require to drill down to a more local level.
./.